Measuring Success: QR Code Analytics That Matter
You've launched your QR code campaign, but how do you know if it's working? Without proper analytics, you're flying blind. In this comprehensive guide, we'll explore the essential metrics, tracking strategies, and data-driven insights that transform QR codes from simple links into powerful marketing tools with measurable ROI.
The Analytics Gap
Studies show that 68% of businesses using QR codes don't track performance metrics beyond basic scan counts. This means they're missing critical insights about user behavior, conversion rates, and campaign ROI that could dramatically improve their results.
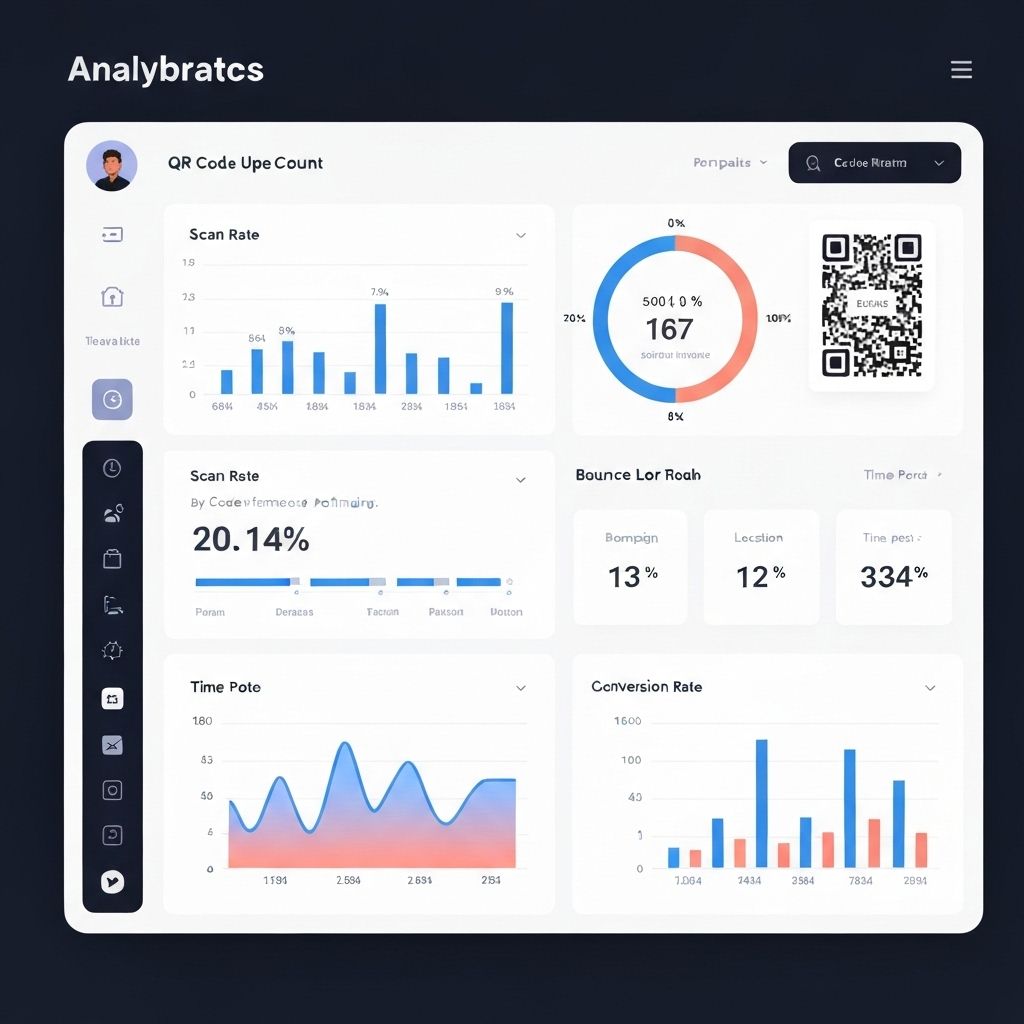
Why QR Code Analytics Matter
QR code analytics provide the data foundation for understanding campaign performance, optimizing user experiences, and proving marketing ROI. Without analytics, you can't answer fundamental questions: Who's scanning? Where are they located? What devices are they using? Are they converting?
Modern QR code platforms like TapX offer comprehensive analytics that go far beyond simple scan counts. You get detailed insights into user demographics, behavior patterns, geographic distribution, device preferences, and conversion funnels. This data transforms QR codes from passive links into active intelligence-gathering tools.
"The difference between successful and failed QR code campaigns isn't the technology—it's the analytics. Companies that track, analyze, and optimize based on data see 3-5x better performance than those who don't."
— Dr. Sarah Chen, Digital Marketing Analytics Expert
Essential QR Code Metrics to Track
1. Total Scans vs. Unique Users
Total scans show overall engagement, but unique users reveal actual reach. A campaign with 1,000 scans from 100 users tells a different story than 1,000 scans from 800 users. Track both metrics to understand engagement depth versus breadth.
2. Scan Location and Geographic Distribution
Understanding where scans occur helps optimize placement strategies. Are your retail QR codes getting more scans near the entrance or checkout? Are certain cities or regions responding better? Geographic data reveals placement effectiveness and regional preferences.
3. Device Types and Operating Systems
Knowing whether users scan with iOS or Android, smartphones or tablets, helps optimize landing page experiences. If 80% of scans come from mobile devices, your destination must be mobile-optimized. Device data ensures technical compatibility.
4. Time and Date Patterns
When do people scan? Understanding temporal patterns helps optimize campaign timing, content updates, and staff allocation. Restaurant QR menus might see peaks during lunch and dinner. Event QR codes spike during specific hours.
5. Conversion Rates and Actions
The most critical metric: what happens after the scan? Track form submissions, purchases, sign-ups, downloads, or any desired action. Conversion rate = (Conversions ÷ Total Scans) × 100. This metric directly ties QR codes to business outcomes.
6. Engagement Duration and Bounce Rate
How long do users stay on your landing page? High bounce rates indicate poor content-QR code alignment. Low engagement duration suggests content isn't compelling. These metrics reveal content quality and relevance.
7. Return on Investment (ROI)
Calculate campaign ROI by comparing costs (QR code creation, printing, placement) against revenue generated from conversions. ROI = ((Revenue - Cost) ÷ Cost) × 100. This metric justifies QR code investments and guides budget allocation.
Setting Up Comprehensive Tracking
Effective QR code analytics require proper setup from the start. Here's how to implement comprehensive tracking:
Use Dynamic QR Codes
Static QR codes can't be tracked beyond basic web analytics. Dynamic QR codes from platforms like TapX provide built-in analytics dashboards, real-time tracking, and the ability to update destinations without reprinting codes.
Implement UTM Parameters
Add UTM parameters to QR code URLs for Google Analytics tracking: utm_source=qr_code, utm_medium=print, utm_campaign=summer_promo. This integrates QR code data with your existing analytics infrastructure.
Set Up Conversion Goals
Define what success looks like before launching. Is it form submissions? Purchases? Downloads? Configure conversion tracking in your analytics platform to measure these specific actions.
Integrate with CRM and Marketing Tools
Connect QR code analytics with your CRM (Salesforce, HubSpot), email marketing platform (Mailchimp), or advertising tools (Facebook Pixel, Google Ads). This creates a complete view of the customer journey from scan to conversion.
"Implementing TapX analytics transformed our QR code strategy. We discovered that 70% of scans happened between 6-8 PM, so we adjusted our content updates accordingly. Conversion rates increased by 156% in just two months."
— Michael Rodriguez, Marketing Director at FitLife Gyms
Analyzing and Interpreting Data
Collecting data is only the first step. The real value comes from analysis and actionable insights:
Identify Patterns and Trends
Look for recurring patterns in your data. Do certain locations consistently outperform others? Are there specific days or times with higher engagement? Pattern recognition reveals optimization opportunities.
Segment Your Audience
Break down analytics by user segments: new vs. returning users, geographic regions, device types, or traffic sources. Segmentation reveals which audiences respond best and helps personalize experiences.
Compare Campaign Performance
Run A/B tests with different QR code designs, placements, or destinations. Compare metrics across campaigns to identify what works best. Data-driven comparison eliminates guesswork.
Calculate Customer Lifetime Value
Don't just measure immediate conversions. Track long-term customer value from QR code acquisitions. A customer acquired through a QR code campaign might generate revenue for years.
Optimization Based on Analytics
Analytics insights should drive continuous optimization:
Improve Low-Performing Placements
If certain QR code locations show low scan rates, test different placements, sizes, or call-to-action messaging. Analytics reveal which placements need improvement.
Optimize Landing Pages
High bounce rates or low engagement duration indicate landing page issues. Use analytics to identify problems, then test improvements: faster loading, clearer messaging, better mobile optimization.
Personalize Content by Segment
Use demographic and behavioral data to personalize experiences. Show different content to first-time vs. returning users, or customize by geographic location. Personalization increases conversion rates.
Adjust Campaign Timing
If analytics show peak engagement times, schedule content updates, promotions, or staff availability accordingly. Timing optimization maximizes impact when users are most engaged.
Advanced Analytics Strategies
Cohort Analysis
Group users by when they first scanned and track their behavior over time. Cohort analysis reveals how user engagement evolves and identifies retention patterns.
Attribution Modeling
Understand how QR codes fit into multi-touch customer journeys. Did the QR code scan lead directly to conversion, or was it one touchpoint among many? Attribution modeling reveals true QR code impact.
Predictive Analytics
Use historical data to predict future performance. Machine learning models can forecast scan volumes, conversion rates, and ROI based on past patterns, helping optimize future campaigns.
Competitive Benchmarking
Compare your QR code performance against industry benchmarks. Are your scan rates above or below average? Benchmarking provides context for evaluating success.
"Advanced analytics turn QR codes into strategic assets. Companies using predictive analytics and cohort analysis see 40% better campaign performance because they're making data-driven decisions instead of guessing."
— James Park, Data Science Lead at Marketing Insights Group
Common Analytics Mistakes to Avoid
Focusing Only on Vanity Metrics
Total scans look impressive but don't tell the full story. Focus on metrics that tie to business outcomes: conversion rates, revenue, customer acquisition cost, and ROI.
Not Setting Baseline Metrics
Without baseline measurements, you can't evaluate improvement. Establish baseline metrics before launching campaigns, then track changes over time.
Ignoring Context
A 5% conversion rate might be excellent for one industry but poor for another. Consider context: campaign goals, industry benchmarks, and historical performance when interpreting data.
Analysis Paralysis
Don't get so caught up in data analysis that you forget to take action. Use analytics to inform decisions, then implement changes and measure results.
The Future of QR Code Analytics
QR code analytics continue evolving with new technologies and capabilities:
AI-Powered Insights
Artificial intelligence automatically identifies patterns, anomalies, and optimization opportunities in QR code data. AI-powered analytics provide actionable recommendations without manual analysis.
Real-Time Personalization
Future QR codes will dynamically adjust destinations based on real-time analytics: user location, time of day, device type, or past behavior. Personalization happens instantly at scan time.
Cross-Platform Attribution
Advanced tracking will follow users across devices and platforms, providing complete journey visibility from QR code scan through multiple touchpoints to final conversion.
Privacy-First Analytics
As privacy regulations evolve, QR code analytics will balance detailed insights with user privacy through anonymization, aggregation, and consent-based tracking.
Frequently Asked Questions
What QR code metrics should I track?
Track total scans, unique users, scan locations, device types, time patterns, conversion rates, engagement duration, and ROI. These metrics provide comprehensive insights into campaign performance.
How do I measure QR code ROI?
Calculate ROI by comparing campaign costs against revenue generated from QR code conversions. Track conversion value, customer acquisition cost, and lifetime value to determine true ROI.
Can I track QR code scans in real-time?
Yes, TapX provides real-time analytics dashboards that show live scan data, user locations, device information, and engagement metrics as they happen.
What's a good QR code scan rate?
Scan rates vary by industry and placement. Retail typically sees 5-15% scan rates, events 20-30%, and direct mail 2-5%. Focus on improving your baseline rather than industry averages.
How do I track QR code conversions?
Use UTM parameters, conversion pixels, and goal tracking in your analytics platform. TapX integrates with Google Analytics, Facebook Pixel, and other tracking tools for comprehensive conversion tracking.
Can I A/B test QR code campaigns?
Yes, create multiple QR codes with different designs, placements, or destinations and compare performance metrics to identify the most effective approach.
What analytics tools integrate with QR codes?
TapX integrates with Google Analytics, Facebook Pixel, Google Tag Manager, HubSpot, Salesforce, and other major marketing and CRM platforms for comprehensive tracking.
How long should I track QR code performance?
Track continuously for ongoing campaigns. For time-limited campaigns, monitor for at least 30 days post-launch to capture delayed scans and understand full performance impact.
Related Products
Tap Cards
Smart business cards with built-in analytics tracking
GolTap
NFC tags with comprehensive scan analytics
GeoQR
Location-based QR codes with geographic tracking
Related Solutions
Retail Solutions
Track in-store QR code performance and customer behavior
Hospitality Solutions
Measure guest engagement with QR code menus and services
Corporate Solutions
Enterprise analytics for large-scale QR code deployments
Related Use Cases
Marketing Campaigns
Track campaign performance with detailed analytics
Event Management
Measure attendee engagement and event ROI
Customer Reviews
Track review collection rates and response patterns
About the Authors


TapX Team
Our team of professionals, consultants, software engineers, AI engineers, and data scientists work together to improve individuals and businesses across Pakistan. We combine technical expertise with deep industry knowledge to deliver practical solutions that drive real results.
Found this article helpful?
Share it with your network to help others understand QR code analytics